11 brilliant ways to use animated maps in different industries.
Many of us often have a difficulty in memorizing or illustrating a map because of its complexities, its changing stance and the dynamic data regarding it.
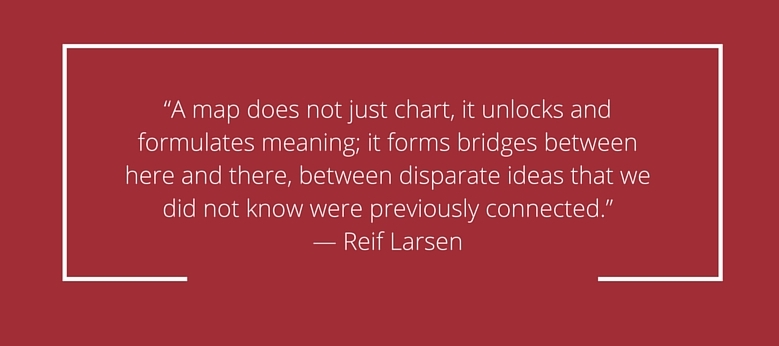
You must have a different perspective of a map, to get a deeper insight.
Because, square feet, miles are just not the dimensions of a map.
There is still another geographical perspective of a map, “The animated map”.
A brief on animated maps.
Norman Thrower in 1959, introduced the concept of animated mapping in ‘Animated Cartography’ ( Cartography is the science or art of drawing maps). He highlighted on the fourth dimension of the static map, the time, a variable which can only be illustrated with Animation.
Animated maps was just a restricted idea then. But, technology had swayed it to its direction and widened its scope. Even then, it had a limited scope. So, to outsource the use of this feature extensively to a wide array of internet population ( which is mostly video viewers), we thought of adding animated maps in videos.
There are endless possibilities of using ‘animated maps’ in different industries. (Education, healthcare, travel and tourism, journalism , marketing etc).
We have brainstormed our minds to give you the possible ways of using animated maps in different industries with real-time examples. This blog article will be a worthwhile reference and you can get back to this whenever you are using an animated map.
1. Census ( Computing patterns)
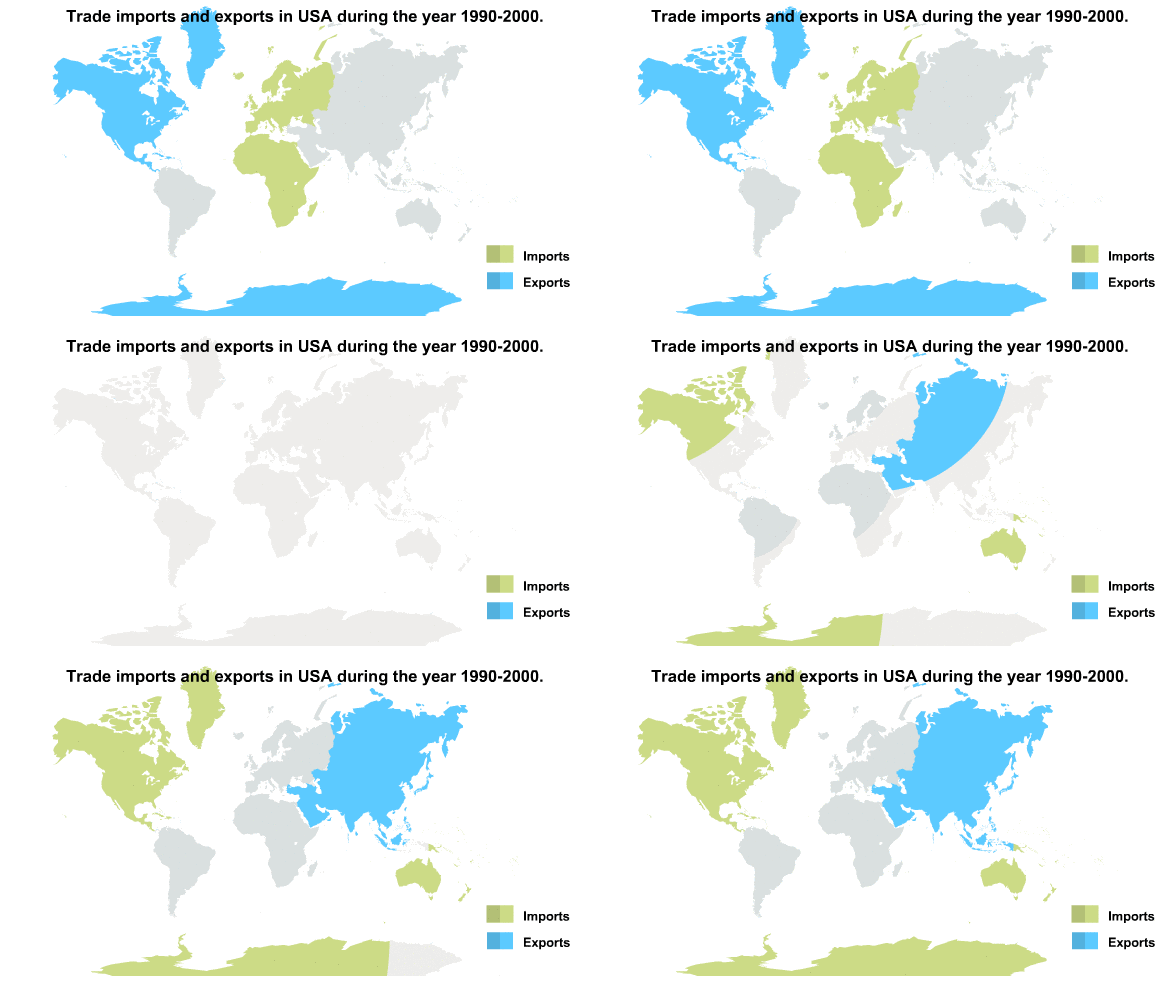
Illustrating country’s economy over a period of time is quite a challenge. But animated maps seems to be tailored for it. Be it patterns of imports , exports, household income, productivity, economic activity or inflation, using animated maps as an illustrative tool seem to be a perfect solution for it.
Example : Trade imports and exports in USA during the year 1990-2000.
2. Natural Disasters
In situations when you want to relay the information of the impact of a natural disaster to the society, animated maps, especially area maps can be useful. Slide swipe maps, perspective maps, flood map, tornado impact map , earthquake magnitude map are some examples of this kind.
3. Healthcare Domain
In healthcare domain , animated maps can be used to get an insight in situations such as health insurance costs under the federal healthcare exchanges, standardized costs, readmission rates of medicare, compare lack of insurance due to possible factors, primary health care providers etc.
4. Travel and tourism.
The best trendy method to illustrate your travel itinerary is by using an animated map video. Instead of long brochures or a clumsy itinerary, a short, crisp and an attractive animated video can replace it. Here is an example of an animated travel itinerary.
5. Journalism
Perhaps one of the most difficult tasks in text journalism is to give readers a sense of geography using only the written word. So animation videos can be a great tool to tell stories using maps instead of the text which, sometimes fail to convey its depth. A distributional quantity, or a geographical representation can be used by journalists to tell any story.
For example, the distribution of solar energy in most part of the country from 1992-2015.
6. Agriculture.
How will you show the demand, supply or source of raw materials in your country over a period of time? Can animated map solve the purpose? You find yourself an answer. A lot more (Forestry, land cultivated, raw materials, inexhaustible and exhaustible sources of energy, distribution, export, import of raw materials) can be illustrated using animated maps.
7.Storytelling.
Every story that starts highlights the location in the foremost place. So, if you are illustrating your story using animated videos, animated maps is just the missing piece that completes the puzzle.
8. Natural resources.
Here is a practical illustrative example of using animated map to exhibit distribution criteria.
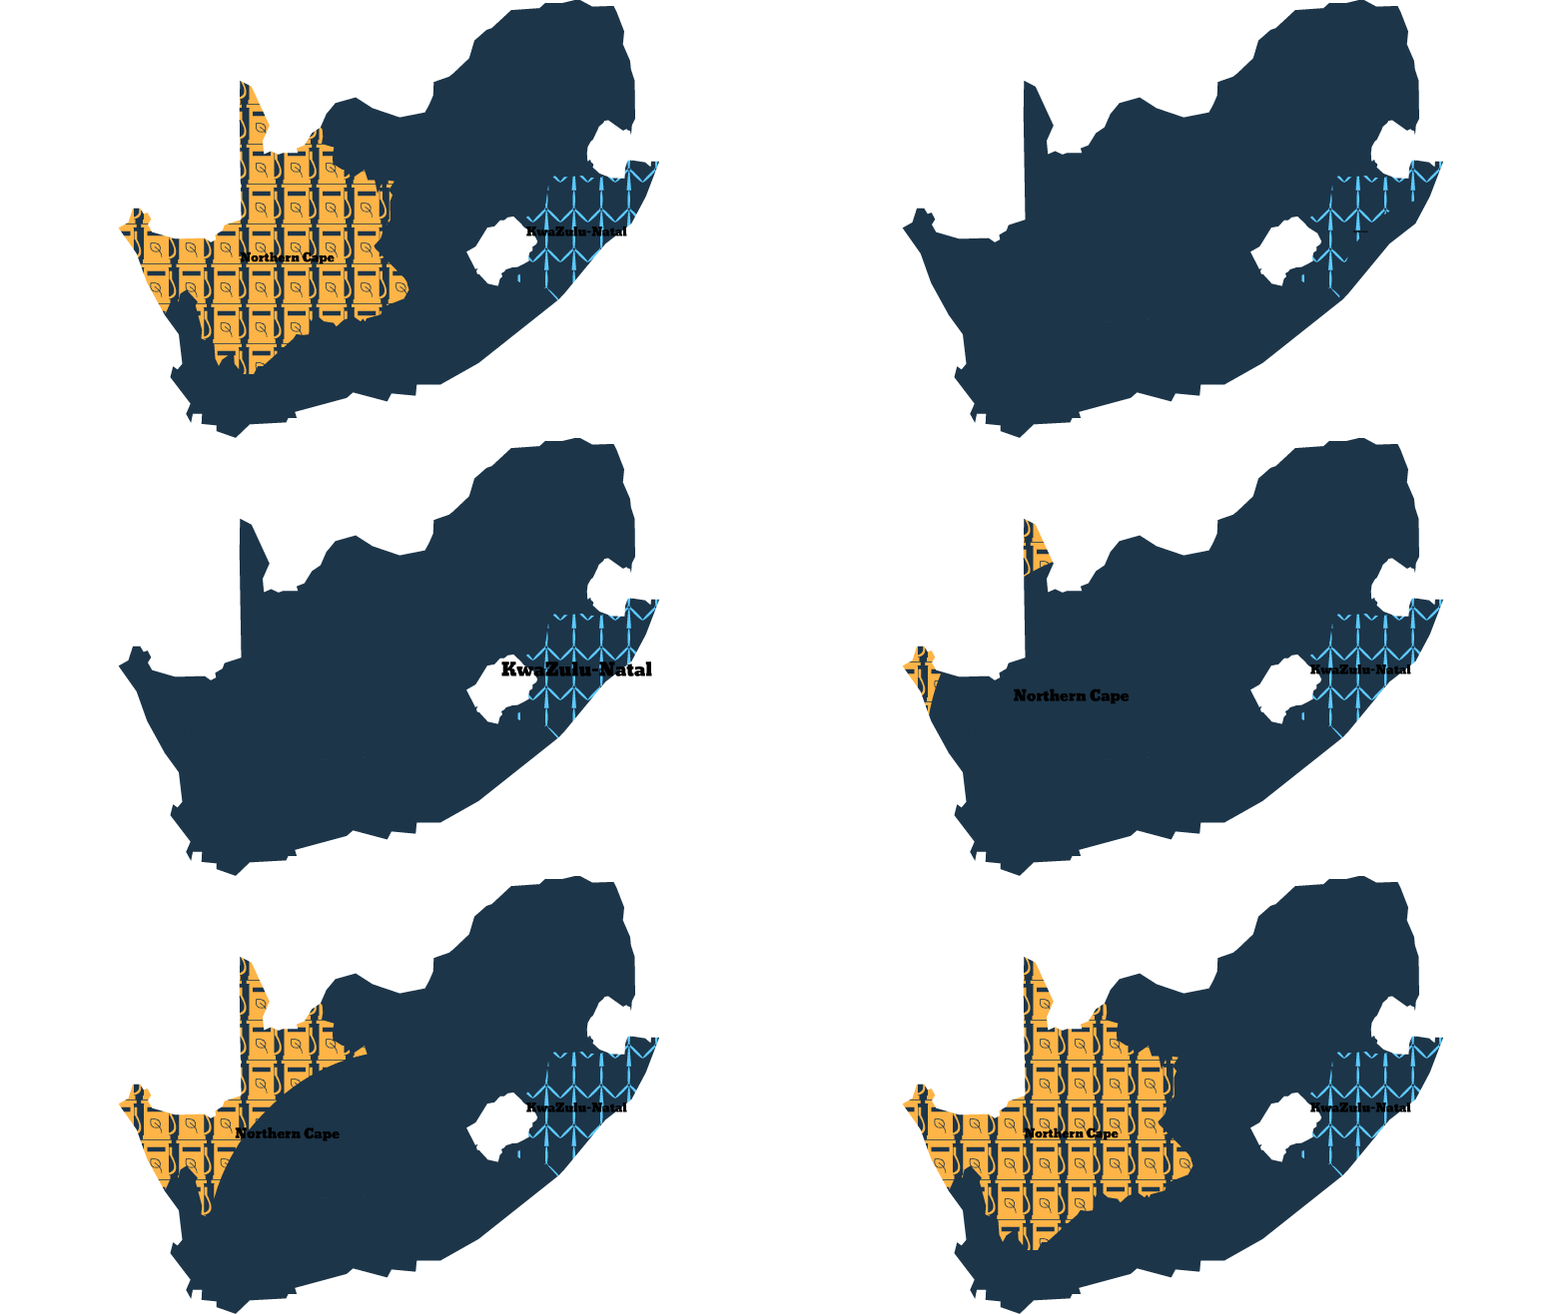
This is the distribution of energy sources in South Africa. Similar to this, you can also use to demonstrate the source map, electricity from sun, energy needs, supply, demand and sources.
9. Business and Marketing.
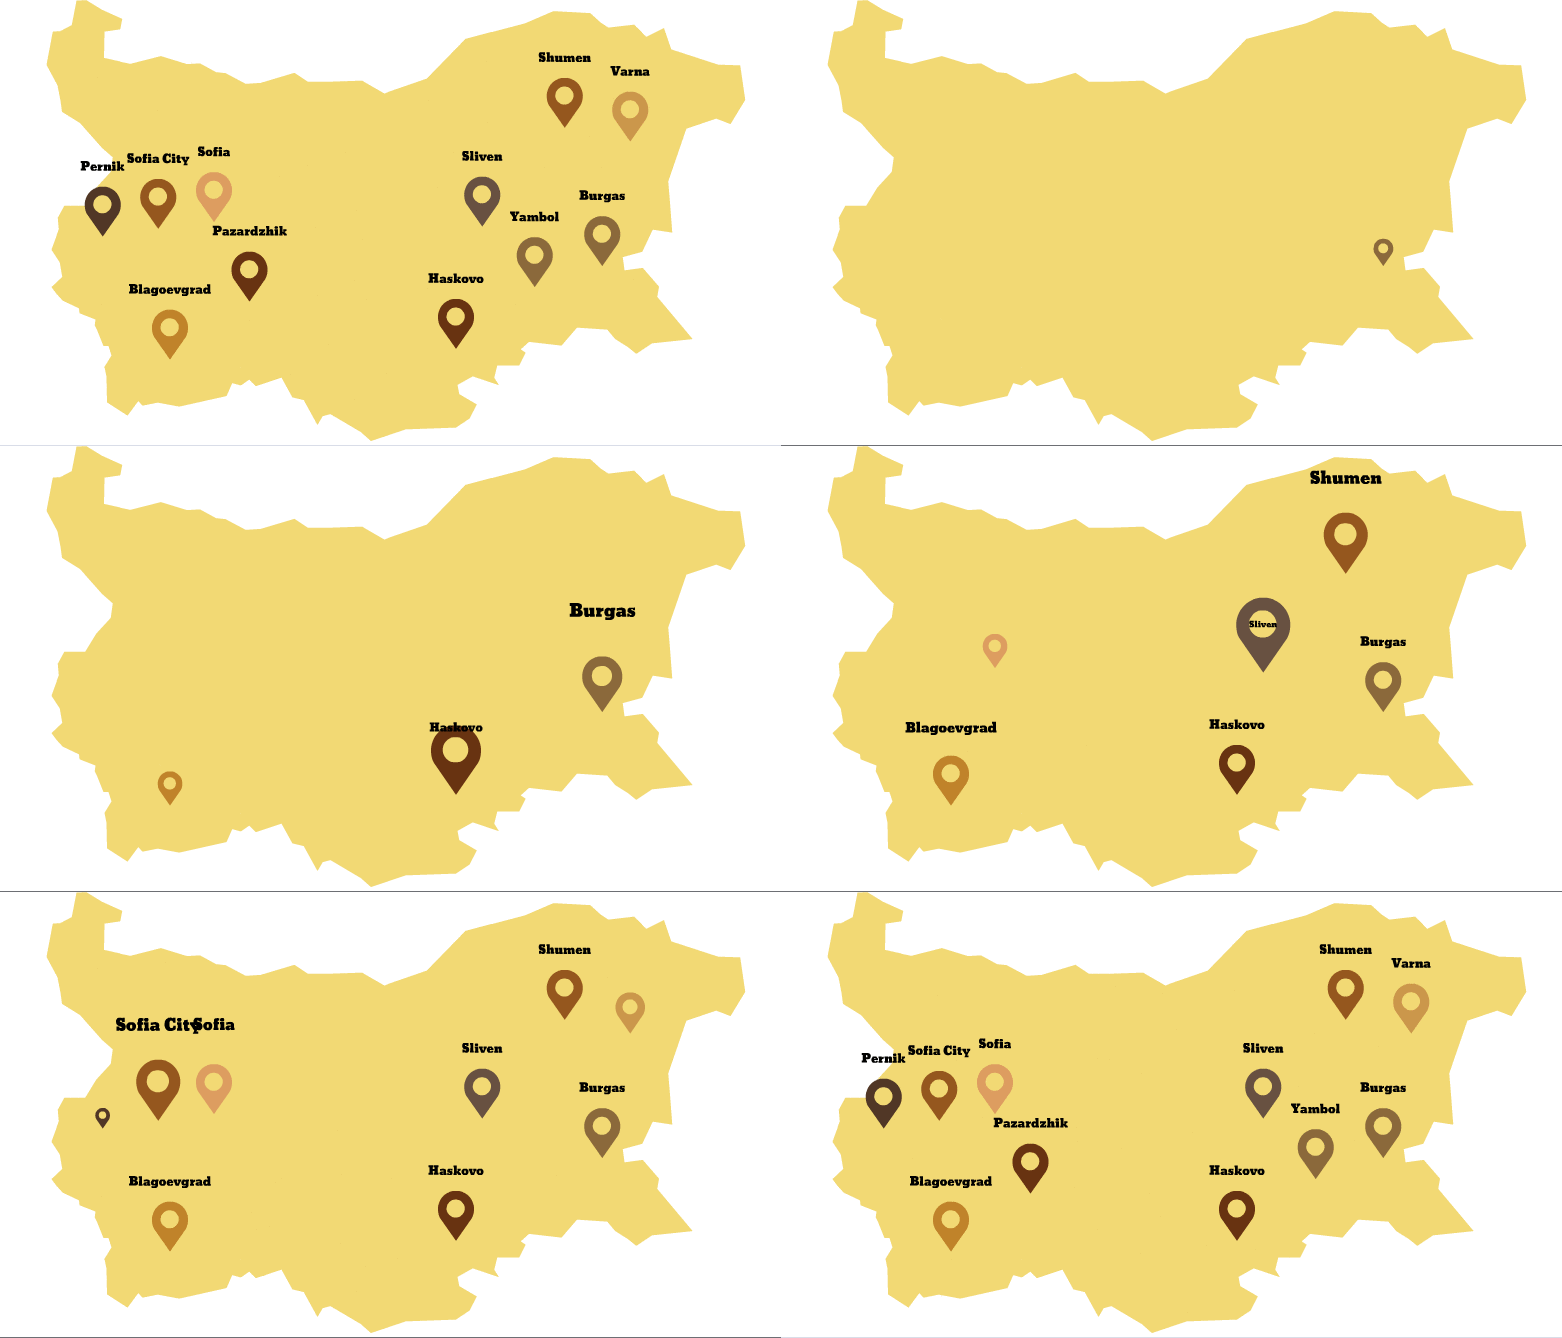
The baseline of any company is its online presence. So, to set a foot apart in the digital society, you need to make some impression. Whilst you make an animation video about your company, you can use an animated map to show the branches of your company in the country.
For example, you can share your success story as to how a dream of being the best burger shop in the country took off so well. Show how, years later, the chain of the branches has spread all over the country.
10. Weather forecast.
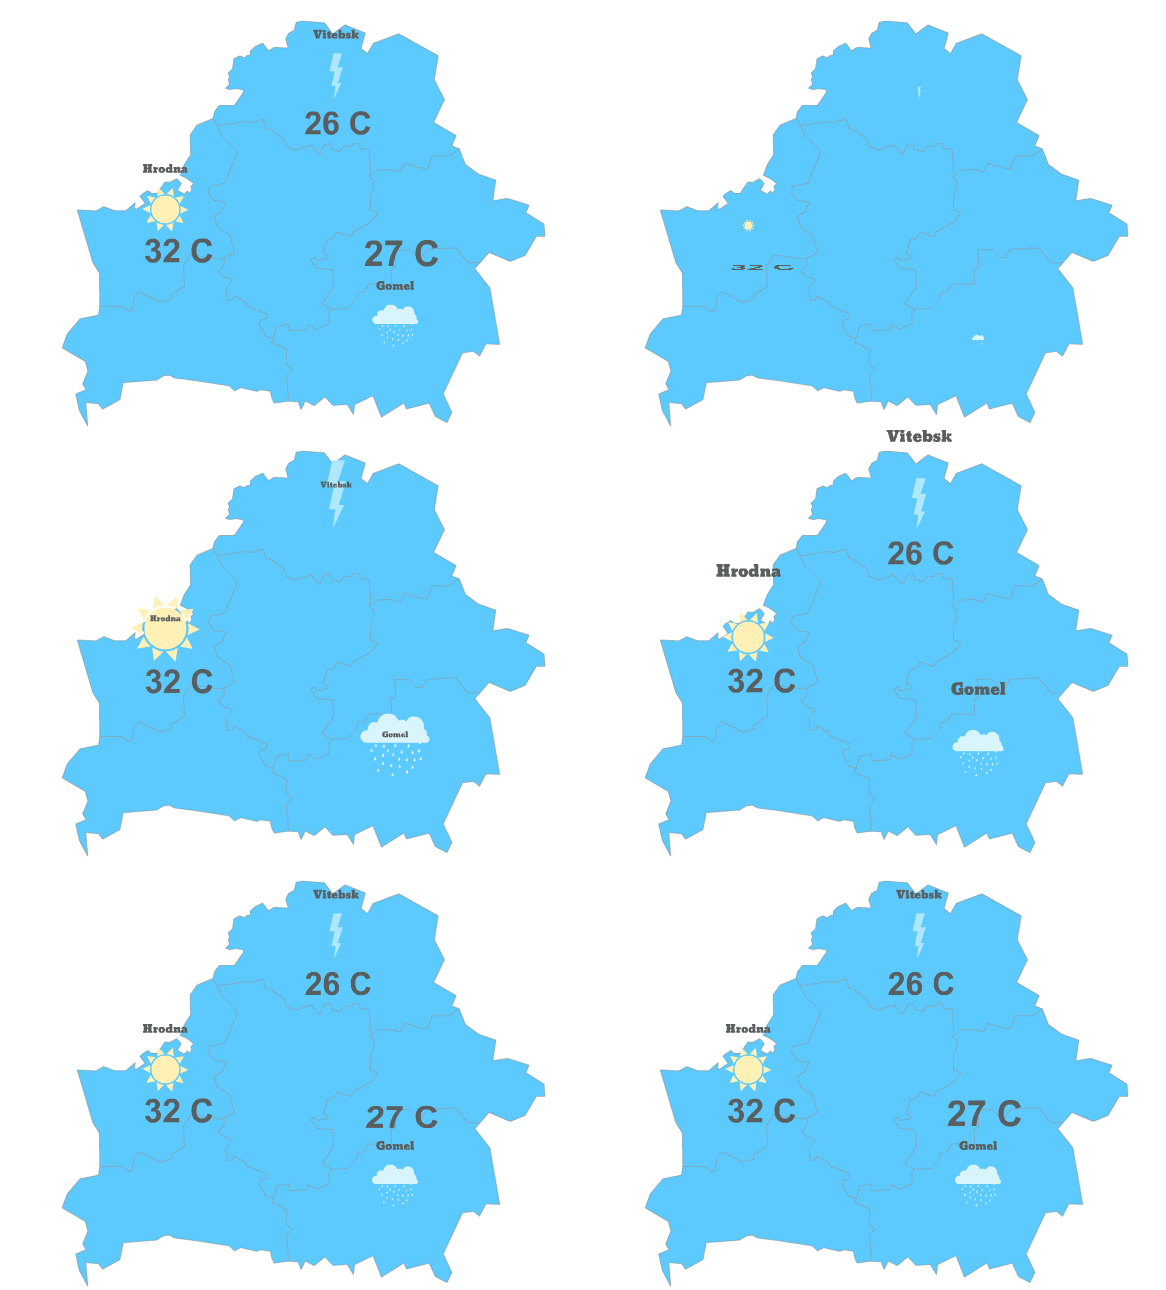
Want to show the parts of the highest rainfall of the country? Or the temperature and environment at different times of the day? Animated maps are already prevalent in this domain and you could see it at the NewsHour everyday. However, using it with a video gives it a whole new perspective.
11. Education.
Last, but not the least, a very diversified domain , education. Social studies are admired by some, while hated by some other students. An easy way to memorize geography, history or civil facts is to create a story out of it. It becomes easier when you use animated maps as the central illustrative tool. For example, the story of the civil war, its facts, figures and the mystery behind it.
There is not an end to this topic, because as you tap your minds , you will find even more areas to explore. Here are few more random bonus examples,
And the good news is that you can use Animaker’s animated map as your graphic tool. It has pre-designed maps (3000+) in number, and 6 exciting map styles which can show any kind of data you want to illustrate.
Start your exciting journey with Animaker’s animated maps and tell us how far you can go. Your valuable suggestions and ideas are welcome!

